Computer Optimization of Acoustics
“How computing can be put to use to create better sound in our rooms.”
[Note: This article was published in the January 2013 issue of Widescreen Review Magazine, and is also available to read on Madrona Digital’s website.]
At the risk of severely dating myself, I got my start in computer technology in 1970s. My first computer ran at one megahertz. No, I didn’t say gigahertz. I said one megahertz or one thousand times smaller. As you may know, this nomenclature refers to the “clock speed” of the CPU. In each cycle, the CPU does some amount of work. Computing has come a long way in the thirty plus years since my one megahertz computer. I just purchased a phone which runs at 1.5 gigahertz and has four times as many “cores.” It therefore has roughly 6,000 times more computing power than my first computer!
What I found wonderful about computers then and now is the speed with which they execute. The CPU in my first computer took four clock cycles to execute or about 250,000 instructions per second. Can you imagine a human doing the same? What the ancient computer did in a second could take you months or years.
Don’t worry. You are still reading Widescreen Review and not some computer magazine. The reason for that intro is that we are going to talk about how computing can be put to use to create better sound in our rooms.
Likely you are familiar with one major use of computing in the form of automatic Equalization or Room EQ as is often called. Here, a special purpose computer called a DSP (seehttp://www.madronadigital.com/Library/DigitalSignalProcessors.html) applies a pre-computed inverse correction curve in an attempt to create a more faithful frequency response for the system. The cost of computing has become so low that this type of compute intensive task which used to require a dedicated box is now a standard feature in even budget AVRs.
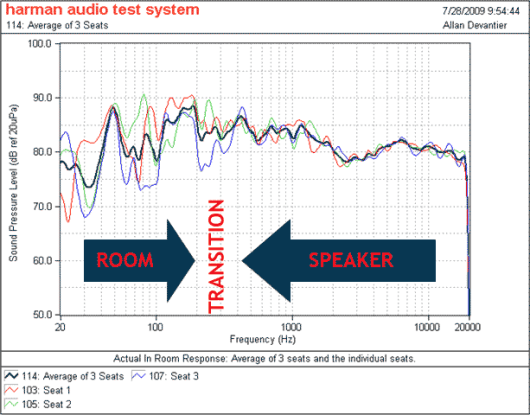
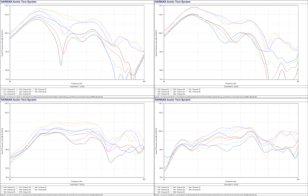
In this article I will cover much less known application of computer technology to other areas of room acoustics. Before we get into that, let’s review a few basics from past articles. The most important thing to remember is that the room impacts the sound of your speaker the most in the lowest frequencies. So much so that the room almost completely dominates the tonal quality of the bass you hear. The measurements in figure 1 nicely demonstrate this concept as you look at the wild frequency response variations below the so called transition frequency of a few hundred hertz.
Figure 1: Impact of room on low frequency response of a speaker shown across multiple seats.
That graph also shows a second problem in that bass response is different for each seat/location in the room. In home theater applications we like to have a wider “sweet spot” than a single seat making this secondary problem one that we must also solve.
A way out of this situation, or at least partially, is to isolate the bass frequencies from our main speakers. That way we can deploy strategies such as multiple subwoofers and their placement to get smoother response. Once there, we can also put equalization and electronic optimization as I describe later to further improve the situation.
This solution as attractive as it is, introduces new issues. One is how to crossover the sound from the mains to the subwoofer. In some sense you are becoming a speaker designer, having to figure out how to smoothly blend the sound of one driver to the next. The drivers happen to be in different boxes (your mains vs. subwoofer) but the problem is one in the same. Most of us are not good speaker designers so attempting to do this manually is likely to generate suboptimal results, especially once we include the room as I will show later.
Actually your job is even more complicated because you are not trying to optimize the performance of one speaker but many. The sub needs to blend in simultaneously with not only your front left and right speakers which may be placed symmetrically, but also the side and rear channels. These speakers are sometimes of different construction and of course different placement from the fronts. Now add the center speaker in a completely different location and potentially different model (e.g. a horizontal type) and the optimal solution starts to quickly slip out of our hands.
Even putting aside the interaction between the subs and the mains, we have the challenge of optimizing multiple subwoofers as far as level, location and frequency response. The researched optimal configurations for multiple subwoofers rely on symmetrical and perfectly rectangular rooms (because they are more easily simulated). Real rooms often are not this way. Addition of doors and different construction detail means we can no longer fully trust these models. Go into an open floor plan like a multi-use living room and the recommendations don’t apply at all.
Let me add another dimension to this: the fact that low frequency response in the room is location specific. Our goal in designing a home theater needs to include similar response at multiple seating positions. Otherwise, we could easily make things worse for some seats as we improve it for others.
While manual optimization here can yield better results than doing nothing, the right optimized solution is quite complex as one looks at permutations that at the extreme are infinite. Just think of what it takes to set the level, delay and crossover/filter setting for four subs, against 7 speakers and 6 seating positions. With the adjustments being analog in nature and hence capable of many variations, you can easily appreciate the complexity of the problem at hand.
Let’s look at how computing power can help with these problems.
Crossover Optimization
The standard cookbook procedure to blend the subwoofer and mains is to select a crossover frequency and call it done (typically 80 Hz). This gets us somewhat close but it assumes that the subwoofer output smoothly drops off as the mains increase with the inverse slope.
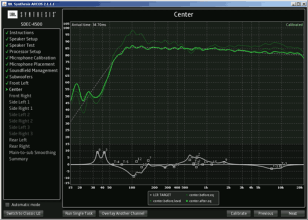
Figure 2 shows the actual measurement of a center speaker (using JBL Synthesis ARCOS system). The faded dark green is the original measurement. Bright green shows application of auto equalization. The dashed line in the graph shows the target response of what the system wanted to arrive at, including application of crossover filter. Above the crossover frequency the match against target is excellent after auto-correction. If you are curious, you can see the filters that are applied at the bottom of the graph in white.
Figure 2: Center speaker frequency response (pre and post equalization).
Looking at the crossover area however, we see that the response is dropping faster than the target. On the other hand, it has resonances in it between 20 and 30 Hz exceeding the level we desire. We clearly have an error from our target of a straight line drop as the frequencies get lower and lower. Even if our subwoofer has a perfect textbook response in the room, we would not achieve a flat response due to these variations. There would be a peak where the resonances are and a trough where the lack of bass response exists in the center speaker.
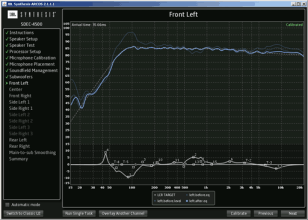
Figure 3 shows the response in the same room from the front left speaker. This speaker does not deviate as much from the crossover frequency as the center. But does show a similar resonance at low frequencies (thus likely a room effect). The point being that what the sub needs to do to fill the bass for this speaker is different than the center. So given a fixed subwoofer setting and hence response, cannot satisfy both speakers equally.
Figure 3: Front left speaker response (pre and post equalization).
While not shown here, the response from the other speakers in this room varied from the ideal just the same. This was the case even though we used identical speakers from the same manufacturer. The locations of the speakers alone introduce variations. And changing models for side and rears as was the case here compounds it.
The measurements that you see here are part of the set of tasks that the JBL Synthesis acoustic optimization called ARCOS performs. The steps it goes through are listed on the left. Next to last is “Main-to-sub Smoothing.” This is where the magic happens in ARCOS as it iterates trying to simultaneously optimize the response of all the speakers against all the subs while being mindful of seat by seat variations.
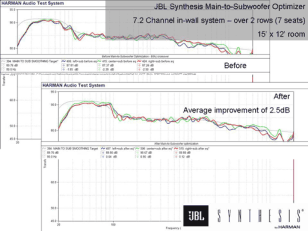
Let’s look at how it works in a series of scenarios starting with Figure 4. This room is a bit on the smaller side at 15 by 12 feet. The top graph shows the response prior to main-to-sub-smoothing (crossover optimization). We notice two problems: a trough at 80 Hz and another around 120 to 130 Hz. The response is actually pretty good considering how large the impact of the room is. Equalization has gotten us close but we can do better with main-to-sub smoothing. The “after” measurement shows the result of this in how both gaps filled in. The target response curve is now more or less inside the group of responses whereas before none of our speakers met that target. As indicated on the graph, the average improvement is a non-trivial 2.5 dB.
Figure 4: Main-to-sub Smoothing for small room.
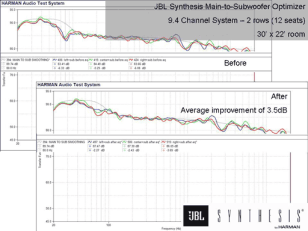
Of course every room and speaker system is different so let’s take a look at a few other scenarios to see how well it performs. Figure 5 is representative of a very large room and system. We are talking 9.4 speaker configuration in a 30×22 foot room. Pre-optimization shows pretty large trough at 80 Hz. Post optimization closes the gap significantly yielding 3.5 dB of improvement. Importantly the response is now smoother which is important perceptually as listening tests shows that is what we prefer.
Figure 5: Main-to-sub Smoothing for large system/room.
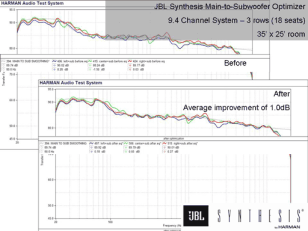
Figure 6 has the response for yet another large, 9.4 configuration. Here the overall response improvement is on the smaller side at 1.0 dB while achieving somewhat better matching of the channels in the bass frequencies.
Figure 6: Main-to-sub Smoothing of another large room showing how channel variation is also reduced.
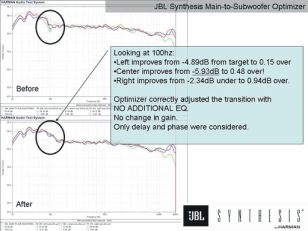
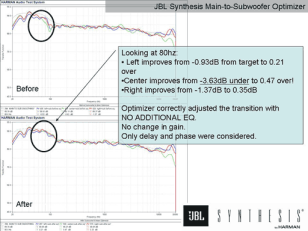
Looking at the specifics in Figure 7 for another room, we have a near 5 dB improvement at 100 Hz. Center channel improves by roughly the same amount. Right channel overshoots a bit to nearly 1 dB from a -2.3 dB before. So while not ideal, it has less deviation from target now. I let you read the Figure 8 for another set of specifics. These improvements came from simply setting the delay/phase to the right value! As the graphs note, no EQ is applied to achieve these gains.
Figure 7: Main-to-sub Smoothing details.
Figure 8: Second example of Main-to-sub Smoothing showing nice improvement across three channels.
Computationally, it took 10 seconds to find these optimal settings and a few minutes of automated measurements. The same work done manually would take days and months probably. Here you sit back and let the computer and software do the work.
Subwoofer Optimization
When optimizing the performance of subwoofers, ideally we meet all of these targets:
1. Least seat to seat variation. The technical term for this is “spatial variation” and a figure of merit is mean spatial variation or MSV. “Mean” if you remember your statistics class, is sort of an average of a set of values that is not influenced unduly by any large variations. “Spatial” is a fancy word that represents different locations in our listening space, i.e. seating positions. Putting them both together, the mean of spatial variation represents how much on the “average” the response varies from one seat to another. Lower the MSV and you lower seat to seat variation and hence, create a more unified experience for everyone watching a movie.
2. Smoothest frequency response. We not only want small seat to seat variation but also smoothest frequency response for each seat. Or else, we will have colorations that while consistent across the seats, still serve to present a sound that is not true to its source.
3. Highest efficiency. This is a metric of how much of the energy of the subwoofers remains in the room post correction and optimization. There are solutions that create equal performance for #1 and #2 but will have varying amount of efficiency as some of the power of a subwoofer is taken out to achieve the other targets. The optimal solution therefore maintains the maximum efficiency while providing excellent frequency response for one seat, and similarly for others.
The tools in your bag are the following:
1. Location and number of subs.
2. Delay/phase for each sub.
3. Filtering the response of each sub (independently of the crossover) which includes setting frequencies and shape of the filter.
Assuming you fix the number and location of subs in advance of computer optimization, you are left with multiple analog parameters being applied to each subwoofer independently. Imagine sitting in your theater turning the dial on each one of these for one sub, then the other and the one after that, all the while attempting to optimize all three criteria stated. Even for a computer such “brute force” method can be insurmountable. For a human, it is impractical to say the least.
In their Audio Engineering Society paper, Harman researchers Allan Devantier and Todd Welti outline a pragmatic approach to solving this. Where appropriate, “heuristics” (smart guesses) and simplifying assumptions are used to achieve the right solution faster. For example, instead of attempting arbitrary frequency response changes to each sub, a single filter is applied. Likewise, intelligence is applied to where to locate that filter such as where the MSV is highest.
While these and many other techniques described in the paper reduce the number of permutations, it is still non-trivial to arrive at an optimal solution. The reason is that the outcome doesn’t necessarily change in a predictable manner. A parameter may make improvements for a while as you increase it but then start to make things worse. Change some other parameter and this progression takes a very different path yet again. With three parameters interacting, this is even tougher than it seems.
The nice thing about computing power these days is that we have a lot of it. So when forced, we can try many permutations to find the most optimal one. Harman has put its research into practice in the form of Sound Field Management or SFM for short, as implemented in the JBL Synthesis ARCOS system. As I described in my earlier Widescreen Review Magazine article on low frequency/subwoofer optimization, SFM is a powerful tool in extracting more performance out of multiple subwoofers in arbitrary rooms. It also accommodates differing subwoofers since its optimizations are based on measurements and iterations of their parameters.
To judge the effectiveness of SFM, let’s look at a case study. Figure 9 shows our pre-optimization/no-EQ response of each of the four subwoofers across different seats. We see all the hallmarks of the room impacting the low frequencies with each sub having uneven response in general, variation with respect to seat to seat, and different from the others. Having all of these subs play together is like having a musical group of four with each singing a different tune! No harmony will come out of that.
Figure 9: Measurement of four subwoofers across multiple seating positions prior to Sound Field Management optimization.
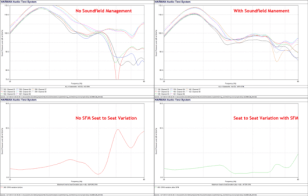
The top left of figure 10 shows what happens when we light up the system with all four subs combining. A couple of seats have reasonable response but the rest suffer from a large trough around 60 Hz. When it comes to low frequency response, we don’t want to see these valleys since they usually are not responsive to equalization. At the large levels here, the drop in response will be readily audible as an artifact.
Figure 10: Subwoofer performance pre and post Sound Field Management optimization. Top: frequency response for each seat without
and with SFM respectively. Bottom: Average seat-to-seat variations without and with SFM optimization. The bottom left graph demonstrates our seat to seat variation which is naturally quite high. The peak is 9 dB which perceptually is twice as loud. Translating, one listener will hear bass that is twice as loud at 60 Hz as someone sitting next to them. Clearly not a good solution.
Application of SFM is shown on the two graphs to the right. The trough is hugely reduced and the response for each seat is now quite a bit more similar. Once again we can look at the measurement of the seat to seat variation and notice a worst case differential of just 3.4 dB, or less than half as much as no SFM.
Do not be concerned with the fact that the response is not ruler flat. Normal equalization is very good at bringing down the level of the peaks. And at any rate, some amount of low frequency boost is what we want anyway. We are used to our rooms emphasizing low frequencies in our everyday life and so some gain needs to be there. Automatic EQ phase of ARCOS takes all of this into account and will produce the right response for us.
Looking under the hoods, SFM plays the following “dials” to find the optimal settings:
1. Delay in milliseconds: 0 (none), 1, 2, 3, 4, 5, 10
2. Single band of EQ at a certain frequency with a level of: 0 (none), -6 and -12 dB
3. Filter Q (sharpness/shape): 1, 4, 16, 24
Measurements were made for each of the four (4) subwoofers from 20 to 80 Hz at 1 Hz steps for eight (8) seats. Optimal response is computed using the above parameters for each seat and then in relationship to every other seat. Assuming my math is right, this is about five (5) million possibilities for any given frequency. Combined, we are talking about 305 million total possibilities to sort through to find the optimal parameters for each subwoofer! As I noted earlier though, the system is smart to not chase non-answers or those that are similar plus other techniques. Still there are a few million possibilities to analyze.
SFM predicts the resulting improvement as it crunches through the possibilities. In this case, it computed a 3.0 dB deviation which is pretty close to the measured deviation of 3.4 dB. Again, this compares to 9 dB variation prior to application of SFM.
Here are the final parameters dialed in by SFM for this theater:
Sub 1: 0 delay; 1 band of EQ -12 dB @64 Hz with Q of 1
Sub 2: 3 msec delay; 1 band of EQ -12 dB @80 Hz with Q of 1
Sub 3: 3 msec delay; 1 band of EQ -12 dB @80 Hz with Q of 16
Sub 4: 4 msec delay; no EQ
The end result looks deceptively simple. Of course what is not is finding the needle the proverbial haystack. It doesn’t matter how much experience you have. You simply can’t intuit such settings when the possibilities are so large.
Hopefully I have made a compelling case for power of computers in improving the sound in our listening spaces. While the solutions I have explained only exist in the JBL Synthesis products today, hopefully with more awareness of the techniques they become available more widely in the future.
I would like to sincerely thank Allan Devantier and Todd Packer of Harman International for their kind permission to use their measurements and their teachings in this article.
Further Reading
The design of Madrona Digital reference home theater.
Low Frequency/Subwoofer Optimizations.
External References
“In-Room Low Frequency Optimization,” Todd Welti, Allan Devantier, 115th Convention, Audio Eng. Soc. Preprint 5942
“Sound Reproduction: The Acoustics and Psychoacoustics of Loudspeakers and Rooms,” Dr. Floyd Toole. Amazon link
“The Subjective and Objective Evaluation of Room Correction Products,” Sean E. Olive, John Jackson, Allan Devantier, David Hunt, Harman International, 127th
Convention, Audio Eng. Soc. Preprint 7960. http://seanolive.blogspot.com/2009/11/subjective-and-objective-evaluation-of.html
“How Many Subwoofers Are Enough,” Todd Welti, 112th Convention, Audio Eng. Soc. Preprint 5602.
JBL Synthesis SDEC-4500 Product Page: SDEC-4500P